jps (JVM 进程状态工具) 通常这样就可以大致看清楚 JVM 应用的基本概况
-l : 输出main类或Jar的全名
-v : 输出携带的 JVM 参数
-m : 输出传入 main 方法的参数
-q : 静默模式,只输出进程号
jstack (查看 JVM 线程堆栈信息) 1
2
3
4
5
6
7
8
9
10
11
12
13
14
15
Usage:
jstack [-l] <pid>
(to connect to running process)
jstack -F [-m] [-l] <pid>
(to connect to a hung process)
jstack [-m] [-l] <executable> <core>
(to connect to a core file)
jstack [-m] [-l] [server_id@]<remote server IP or hostname>
(to connect to a remote debug server)
Options:
-F to force a thread dump. Use when jstack <pid> does not respond (process is hung)
-m to print both java and native frames (mixed mode)
-l long listing. Prints additional information about locks
-h or -help to print this help message
我们来试图定位一个 JVM 进程中某个线程的信息情况,可以这么玩:
找到我的应用进程1
90147 KafkaService-1.3.jar
根据进程号,分析进程中线程的资源占用情况1
2
3
4
5
6
7
8
9
10
11
12
13
14
15
16
17
18
19
20
21
22
23
24
25
26
27
28
29
30
31
32
33
[appadm@abcacb ~]$ top -Hp 90147
top - 09:55:31 up 124 days, 9:02, 2 users, load average: 0.00, 0.00, 0.00
Tasks: 237 total, 0 running, 237 sleeping, 0 stopped, 0 zombie
Cpu(s): 0.2%us, 0.1%sy, 0.0%ni, 99.7%id, 0.1%wa, 0.0%hi, 0.0%si, 0.0%st
Mem: 8017400k total, 7170424k used, 846976k free, 162736k buffers
Swap: 4063224k total, 383048k used, 3680176k free, 1130284k cached
PID USER PR NI VIRT RES SHR S %CPU %MEM TIME+ COMMAND
90147 appadm 20 0 4545m 254m 6104 S 0.0 3.3 0:00.00 java
90148 appadm 20 0 4545m 254m 6104 S 0.0 3.3 0:07.09 java
90149 appadm 20 0 4545m 254m 6104 S 0.0 3.3 0:07.34 java
90150 appadm 20 0 4545m 254m 6104 S 0.0 3.3 0:06.81 java
90151 appadm 20 0 4545m 254m 6104 S 0.0 3.3 0:07.03 java
90152 appadm 20 0 4545m 254m 6104 S 0.0 3.3 0:06.91 java
90153 appadm 20 0 4545m 254m 6104 S 0.0 3.3 1:10.42 java
90154 appadm 20 0 4545m 254m 6104 S 0.0 3.3 0:00.20 java
90155 appadm 20 0 4545m 254m 6104 S 0.0 3.3 0:00.30 java
90156 appadm 20 0 4545m 254m 6104 S 0.0 3.3 0:00.00 java
90157 appadm 20 0 4545m 254m 6104 S 0.0 3.3 0:11.09 java
90158 appadm 20 0 4545m 254m 6104 S 0.0 3.3 0:10.63 java
90159 appadm 20 0 4545m 254m 6104 S 0.0 3.3 0:00.00 java
90160 appadm 20 0 4545m 254m 6104 S 0.0 3.3 14:59.61 java
90171 appadm 20 0 4545m 254m 6104 S 0.0 3.3 0:10.01 java
90172 appadm 20 0 4545m 254m 6104 S 0.0 3.3 0:05.77 java
90173 appadm 20 0 4545m 254m 6104 S 0.0 3.3 1:37.43 java
90175 appadm 20 0 4545m 254m 6104 S 0.0 3.3 1:27.36 java
90181 appadm 20 0 4545m 254m 6104 S 0.0 3.3 1:51.68 java
90182 appadm 20 0 4545m 254m 6104 S 0.0 3.3 2:06.57 java
90183 appadm 20 0 4545m 254m 6104 S 0.0 3.3 2:15.84 java
90184 appadm 20 0 4545m 254m 6104 S 0.0 3.3 1:59.09 java
90185 appadm 20 0 4545m 254m 6104 S 0.0 3.3 1:41.50 java
90186 appadm 20 0 4545m 254m 6104 S 0.0 3.3 0:00.02 java
90187 appadm 20 0 4545m 254m 6104 S 0.0 3.3 0:06.92 java
可以发现有一个线程存活的时间非常长1
90160 appadm 20 0 4545 m 254 m 6104 S 0.0 3.3 14 :59.61 java
将其线程号转化成16进制1
2
[appadm@abcabc ~]$ printf '%x\n' 90160
16030
通过 jstack 命令查到对应线程的堆栈
1
2
[appadm@abcabc ~]$ jstack 90147 | grep 16030
"VM Periodic Task Thread" prio=10 tid=0x00007ff094168800 nid=0x16030 waiting on condition
当然,jstack 也可以看到某些你指定的线程是否存活。
jmap(堆内存审查工具) jmap 用于查看堆内存使用状况,下面介绍 jmap 的用法
1
2
3
4
5
6
7
8
9
10
11
12
13
14
15
16
17
18
19
20
21
22
23
24
25
26
27
28
Usage:
jmap [option] <pid>
(to connect to running process)
jmap [option] <executable <core>
(to connect to a core file)
jmap [option] [server_id@]<remote server IP or hostname>
(to connect to remote debug server)
where <option> is one of:
<none> to print same info as Solaris pmap
-heap to print java heap summary
-histo[:live] to print histogram of java object heap; if the "live"
suboption is specified, only count live objects
-permstat to print permanent generation statistics
-finalizerinfo to print information on objects awaiting finalization
-dump:<dump-options> to dump java heap in hprof binary format
dump-options:
live dump only live objects; if not specified,
all objects in the heap are dumped.
format=b binary format
file=<file> dump heap to <file>
Example: jmap -dump:live,format=b,file=heap.bin <pid>
-F force. Use with -dump:<dump-options> <pid> or -histo
to force a heap dump or histogram when <pid> does not
respond. The "live" suboption is not supported
in this mode.
-h | -help to print this help message
-J<flag> to pass <flag> directly to the runtime system
继续刚才那个进程901471
2
3
4
5
6
7
8
9
10
11
12
13
14
15
16
17
18
19
20
21
22
23
24
25
26
27
28
29
30
31
32
33
34
35
36
37
38
39
40
41
42
[appadm@abcabc ~]$ jmap -permstat 90147|more
Attaching to process ID 90147, please wait...
Debugger attached successfully.
Server compiler detected.
JVM version is 24.79-b02
finding class loader instances ..done.
computing per loader stat ..done.
please wait.. computing liveness.liveness analysis may be inaccurate ...
class_loader classes bytes parent_loader alive? type
<bootstrap> 2015 11213792 null live <internal>
0x0000000086458398 0 0 0x0000000085c2e558 dead org/springframework/data/convert/ClassGeneratingEntityInstantiator$ObjectInstantiatorClassGenerator$ByteArray
ClassLoader@0x00000000826409a8
0x0000000085e12220 1 3064 0x0000000085c2e558 dead sun/reflect/DelegatingClassLoader@0x0000000080850b58
0x0000000086096420 1 3064 0x0000000085c2e558 dead sun/reflect/DelegatingClassLoader@0x0000000080850b58
0x00000000860960a0 1 3064 0x0000000085c2e558 dead sun/reflect/DelegatingClassLoader@0x0000000080850b58
0x0000000086759478 1 3064 null dead sun/reflect/DelegatingClassLoader@0x0000000080850b58
0x0000000086669638 1 1888 null dead sun/reflect/DelegatingClassLoader@0x0000000080850b58
0x0000000085e12260 1 3064 0x0000000085c2e558 dead sun/reflect/DelegatingClassLoader@0x0000000080850b58
0x00000000867594b8 1 1912 0x0000000085c2e558 dead sun/reflect/DelegatingClassLoader@0x0000000080850b58
0x0000000085c0d2b8 1 1888 null dead sun/reflect/DelegatingClassLoader@0x0000000080850b58
0x0000000085e122a0 1 3032 0x0000000085c2e558 dead sun/reflect/DelegatingClassLoader@0x0000000080850b58
0x000000008634e330 1 1912 0x0000000085c2e558 dead sun/reflect/DelegatingClassLoader@0x0000000080850b58
0x00000000867594f8 1 3048 null dead sun/reflect/DelegatingClassLoader@0x0000000080850b58
0x0000000085c0d2f8 1 1888 null dead sun/reflect/DelegatingClassLoader@0x0000000080850b58
0x0000000085e122e0 1 3032 0x0000000085c2e558 dead sun/reflect/DelegatingClassLoader@0x0000000080850b58
0x0000000085e12320 1 3064 0x0000000085c2e558 dead sun/reflect/DelegatingClassLoader@0x0000000080850b58
0x0000000086759538 1 3064 null dead sun/reflect/DelegatingClassLoader@0x0000000080850b58
0x00000000867637e8 1 1912 0x0000000085c2e558 dead sun/reflect/DelegatingClassLoader@0x0000000080850b58
0x0000000085e12360 1 3032 0x0000000085c2e558 dead sun/reflect/DelegatingClassLoader@0x0000000080850b58
0x0000000086759578 1 1888 null dead sun/reflect/DelegatingClassLoader@0x0000000080850b58
0x000000008613b0a0 0 0 0x0000000085c2e558 dead org/springframework/boot/context/embedded/tomcat/TomcatEmbeddedWebappClassLoader@0x000000008216e0f8
0x0000000085e123a0 1 3064 0x0000000085c2e558 dead sun/reflect/DelegatingClassLoader@0x0000000080850b58
0x0000000085c2e558 5348 29902968 0x0000000085c1dec8 dead org/springframework/boot/loader/LaunchedURLClassLoader@0x0000000080aa0010
0x00000000867595b8 1 3168 0x0000000085c2e558 dead sun/reflect/DelegatingClassLoader@0x0000000080850b58
0x00000000860b2580 1 1888 0x0000000085c2e558 dead sun/reflect/DelegatingClassLoader@0x0000000080850b58
0x0000000085e123e0 1 3072 0x0000000085c2e558 dead sun/reflect/DelegatingClassLoader@0x0000000080850b58
0x0000000086097ea0 1 3072 0x0000000085c2e558 dead sun/reflect/DelegatingClassLoader@0x0000000080850b58
0x00000000867595f8 1 3048 null dead sun/reflect/DelegatingClassLoader@0x0000000080850b58
0x00000000860ad318 1 1888 0x0000000085c2e558 dead sun/reflect/DelegatingClassLoader@0x0000000080850b58
0x0000000086759678 1 3048 0x0000000085c2e558 dead sun/reflect/DelegatingClassLoader@0x0000000080850b58
--More--
堆内存使用状况审查,包含所指定的 GC 算法、堆配置、以及新生代、老年代和永久代的内存占用情况1
2
3
4
5
6
7
8
9
10
11
12
13
14
15
16
17
18
19
20
21
22
23
24
25
26
27
28
29
30
31
32
33
34
35
36
37
38
39
40
41
42
43
44
45
46
47
48
49
50
51
[appadm@abcabc ~]$ jmap -heap 90147
Attaching to process ID 90147, please wait...
Debugger attached successfully.
Server compiler detected.
JVM version is 24.79-b02
using thread-local object allocation.
Parallel GC with 4 thread(s)
Heap Configuration:
Min HeapFreeRatio = 0
MaxHeapFreeRatio = 100
MaxHeapSize = 2053111808 (1958.0MB)
NewSize = 1310720 (1.25MB)
MaxNewSize = 17592186044415 MB
OldSize = 5439488 (5.1875MB)
NewRatio = 2
SurvivorRatio = 8
PermSize = 21757952 (20.75MB)
MaxPermSize = 85983232 (82.0MB)
G1HeapRegionSize = 0 (0.0MB)
Heap Usage:
PS Young Generation
Eden Space:
capacity = 23592960 (22.5MB)
used = 2480648 (2.3657302856445312MB)
free = 21112312 (20.13426971435547MB)
10.514356825086805% used
From Space:
capacity = 1048576 (1.0MB)
used = 515424 (0.491546630859375MB)
free = 533152 (0.508453369140625MB)
49.1546630859375% used
To Space:
capacity = 1048576 (1.0MB)
used = 0 (0.0MB)
free = 1048576 (1.0MB)
0.0% used
PS Old Generation
capacity = 47185920 (45.0MB)
used = 32177488 (30.686843872070312MB)
free = 15008432 (14.313156127929688MB)
68.19298638237848% used
PS Perm Generation
capacity = 85983232 (82.0MB)
used = 40674656 (38.790374755859375MB)
free = 45308576 (43.209625244140625MB)
47.30533506812119% used
15379 interned Strings occupying 2109944 bytes.
查看存活的对象在堆内存中的对象信息(对象实例数、大小、类名)1
2
3
4
5
6
7
8
9
10
11
12
13
14
15
16
17
18
19
20
21
22
23
24
25
26
27
28
29
30
31
32
33
34
35
[appadm@abcabc ~]$ jmap -histo:live 90147|more
num #instances #bytes class name
----------------------------------------------
1: 71828 9997912 <constMethodKlass>
2: 71828 9204032 <methodKlass>
3: 7004 7711224 <constantPoolKlass>
4: 40648 6815008 [C
5: 6999 4958288 <instanceKlassKlass>
6: 5660 4080704 <constantPoolCacheKlass>
7: 23229 2120696 [B
8: 3438 1643176 <methodDataKlass>
9: 39426 946224 java.lang.String
10: 7516 719768 java.lang.Class
11: 11584 585000 [[I
12: 10241 576304 [S
13: 15937 509984 java.util.concurrent.ConcurrentHashMap$HashEntry
14: 11697 467880 java.util.LinkedHashMap$Entry
15: 5662 452960 java.lang.reflect.Method
16: 629 329352 [I
17: 3982 319520 [Ljava.util.HashMap$Entry;
18: 9684 309888 java.util.HashMap$Entry
19: 500 272000 <objArrayKlassKlass>
20: 3988 223328 java.util.LinkedHashMap
21: 4459 208776 [Ljava.lang.Object;
22: 13045 208720 java.lang.Object
23: 1381 146992 [Ljava.util.concurrent.ConcurrentHashMap$HashEntry;
24: 2261 90440 java.lang.ref.SoftReference
25: 1869 89712 java.util.HashMap
26: 2324 74368 java.util.concurrent.locks.ReentrantLock$NonfairSync
27: 3047 73128 java.util.ArrayList
28: 1721 72120 [Ljava.lang.String;
29: 735 70560 org.springframework.beans.GenericTypeAwarePropertyDescriptor
30: 3351 67552 [Ljava.lang.Class;
--More--
关于 class name 对象类型说明1
2
3
4
5
6
7
8
9
B byte
C char
D double
F float
I int
J long
Z boolean
[ 数组,如[I表示int []
[L+类名 其他对象
jhat (堆内存可视化分析工具) jhat 是 jmap 的辅助工具,可以利用 jmap dump 出的数据文件做一个 web 端的可视化审查,我们先利用 jmap dump 出内存快照1
jmap -dump:format=b,file=/tmp/dump.dat 90147
然后利用 jhat 对 dump.dat 进行分析1
2
3
4
5
6
7
8
9
10
11
12
13
14
15
16
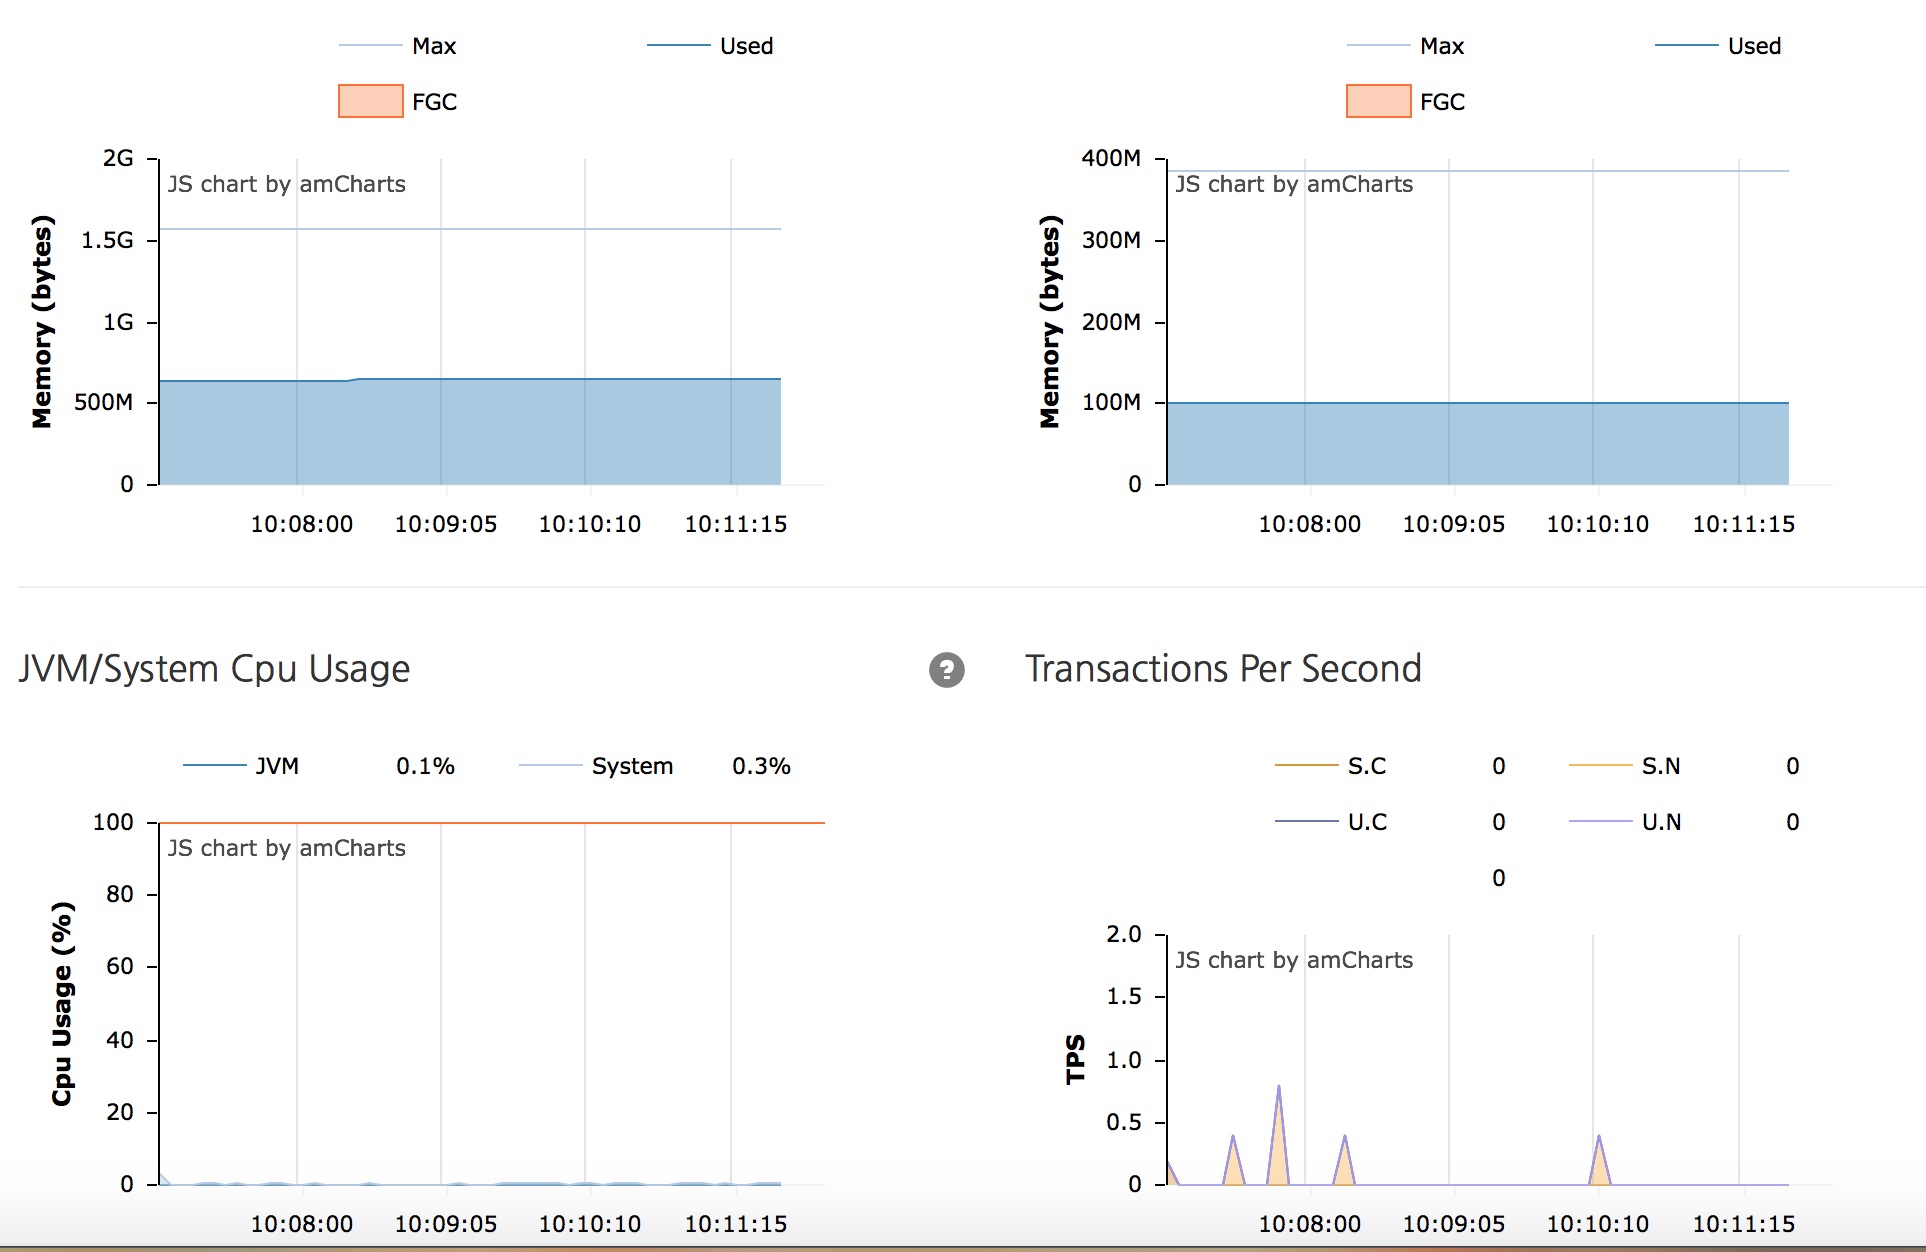
[appadm@abcabc ~]$ jhat -port 9998 /tmp/dump.dat
Reading from /tmp/dump.dat...
Dump file created Fri Apr 14 11:12:07 CST 2017
Snapshot read, resolving...
Resolving 355064 objects...
WARNING: Failed to resolve object id 0x86690ef8 for field clazz (signature L)
WARNING: Failed to resolve object id 0x86690718 for field clazz (signature L)
WARNING: Failed to resolve object id 0x86690248 for field clazz (signature L)
WARNING: Failed to resolve object id 0x863dada8 for field clazz (signature L)
WARNING: Failed to resolve object id 0x863da810 for field clazz (signature L)
WARNING: Failed to resolve object id 0x863da6d0 for field clazz (signature L)
Chasing references, expect 71 dots.......................................................................
Eliminating duplicate references.......................................................................
Snapshot resolved.
Started HTTP server on port 9998
Server is ready.
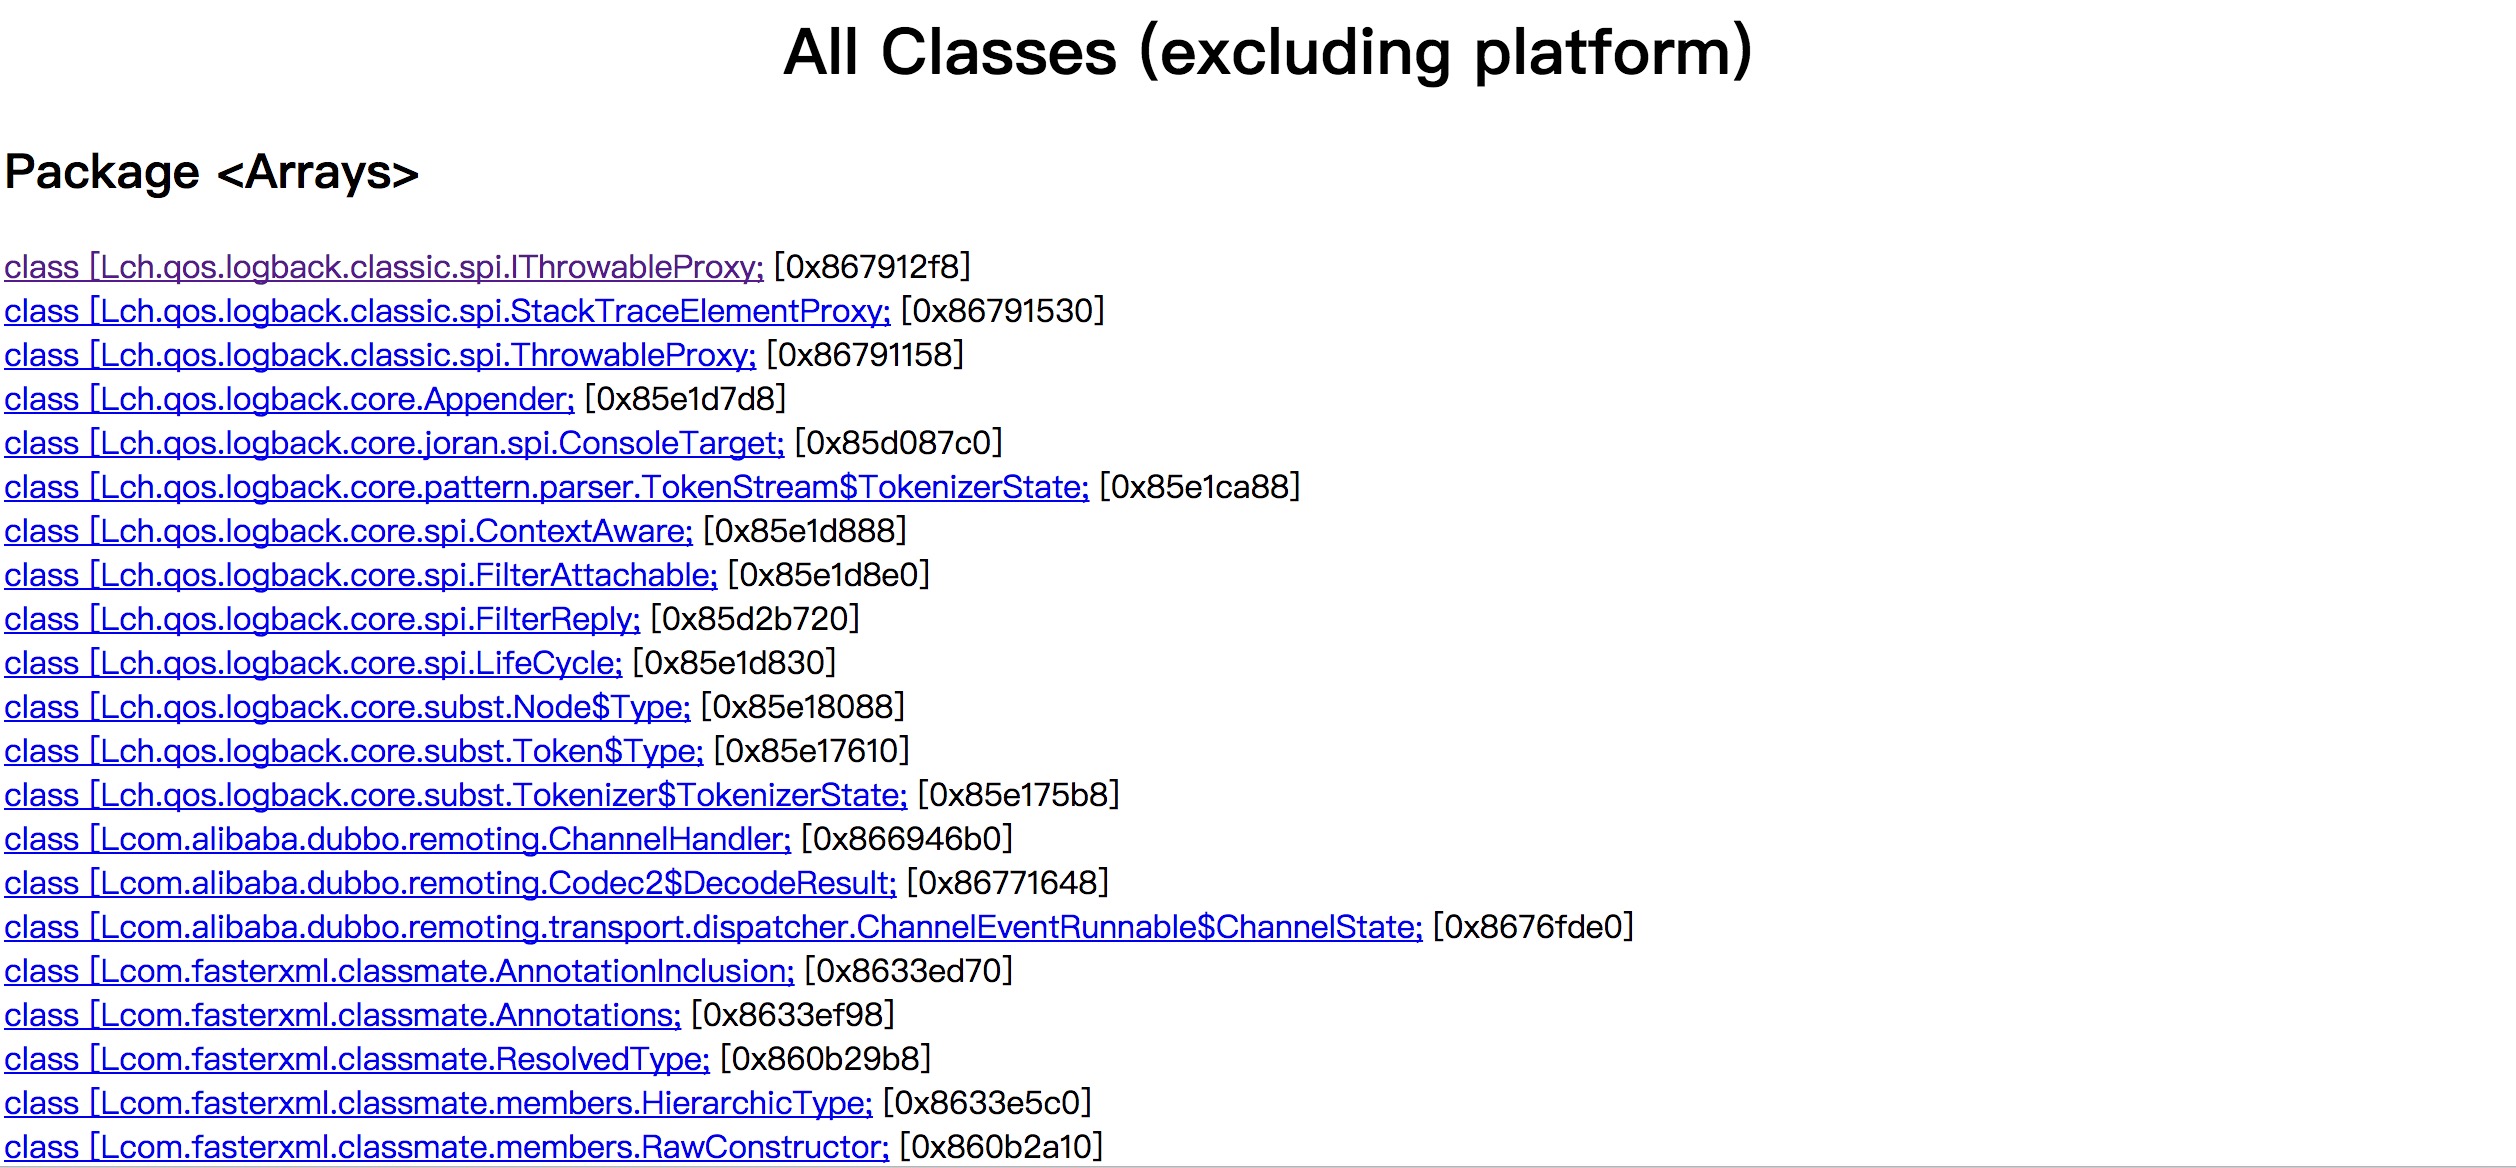
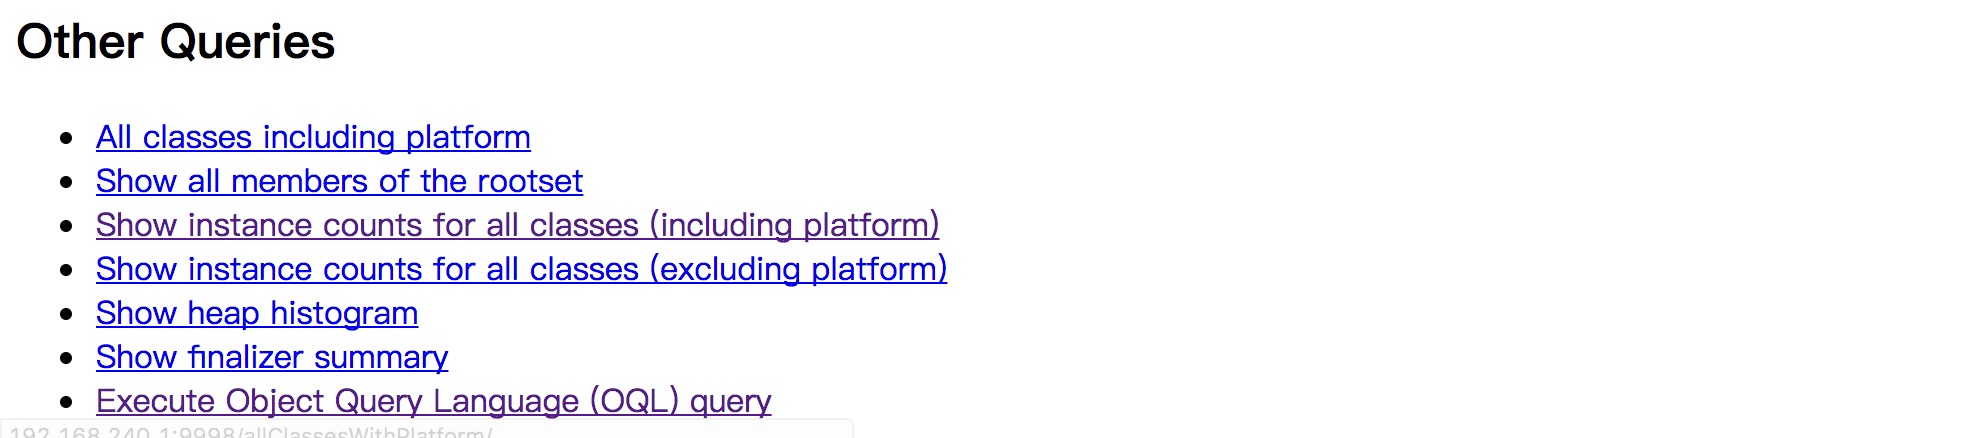
这时候访问 localhost:9998 就可以看到
jstat (JVM 统计工具) 1
2
3
4
5
6
7
8
9
10
11
12
13
14
15
16
17
18
19
20
Usage: jstat -help|-options
jstat -<option> [-t] [-h<lines>] <vmid> [<interval> [<count>]]
Definitions:
<option> An option reported by the -options option
<vmid> Virtual Machine Identifier. A vmid takes the following form:
<lvmid>[@<hostname>[:<port>]]
Where <lvmid> is the local vm identifier for the target
Java virtual machine, typically a process id; <hostname> is
the name of the host running the target Java virtual machine;
and <port> is the port number for the rmiregistry on the
target host. See the jvmstat documentation for a more complete
description of the Virtual Machine Identifier.
<lines> Number of samples between header lines.
<interval> Sampling interval. The following forms are allowed:
<n>["ms"|"s"]
Where <n> is an integer and the suffix specifies the units as
milliseconds("ms") or seconds("s"). The default units are "ms".
<count> Number of samples to take before terminating.
-J<flag> Pass <flag> directly to the runtime system.
现在每隔 2.5s 打印一次 jvm 进程 GC 数据1
2
3
4
5
[appadm@abcabc tmp]$ jstat -gc 90147 2500
S0C S1C S0U S1U EC EU OC OU PC PU YGC YGCT FGC FGCT GCT
1024.0 512.0 0.0 320.0 22016.0 20264.2 41472.0 14646.5 60416.0 39721.3 3635 27.576 10 1.063 28.639
1024.0 512.0 0.0 320.0 22016.0 20375.0 41472.0 14646.5 60416.0 39721.3 3635 27.576 10 1.063 28.639
1024.0 512.0 0.0 320.0 22016.0 20375.0 41472.0 14646.5 60416.0 39721.3 3635 27.576 10 1.063 28.639
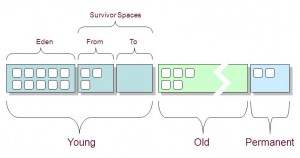
现在解释一下这些是什么意思,先来看看 Java 内存模型
堆内存由 年轻代、老年代、永久代构成;
年轻代分为 Eden 区和两个 Survivor 区(From&To)
jstat 各参数含义
S0C、S1C、S0U、S1U:Survivor 0/1区容量(Capacity)和使用量(Used)
EC、EU:Eden区容量和使用量
OC、OU:年老代容量和使用量
PC、PU:永久代容量和使用量
YGC、YGT:年轻代GC次数和GC耗时
FGC、FGCT:Full GC次数和Full GC耗时
GCT:GC总耗时
GC 常识 Young Generation 中为什么需要 Survivor 区?
假设我们的 Java 内存模型是这样的1
2
3
4
5
*******************************
* * *
* Eden * Tenured *
* * *
*******************************
YGC 本身是很频繁的(由于 Eden 区内存很小,回收的速度非常快),因此在每次当 Eden 区满的时候,执行 MinorGC(YGC),则会将 Object 直接丢到 Tenured 之中,这样一来 Tenured 很快就满了(理论来说 Tenured 空间比 Eden 大很多),此时会触发 MajorGC,MajorGC 会配合 MinGC 执行一次 Full GC。
因此这里引入了 Survivor 区,对于在规定的 YGC 次数下,其仍然不能够回收掉的数据,将会直接丢入 Tenured 区,否则将被回收。这大大减少了数据进入 Tenured 的门槛,随之而来的就是减少了 MajorGC 的执行频率。 1
2
3
4
5
***************************************************
* * * *
* Eden * Survivor * Tenured *
* * * *
***************************************************
Survivor 为什么要区分为 From 和 To 两个区块?
上面的模型看似很美好,也的确一定程度上解决了 Tenured 增长过快的问题,然而 Survivor 区本身问题也很大。
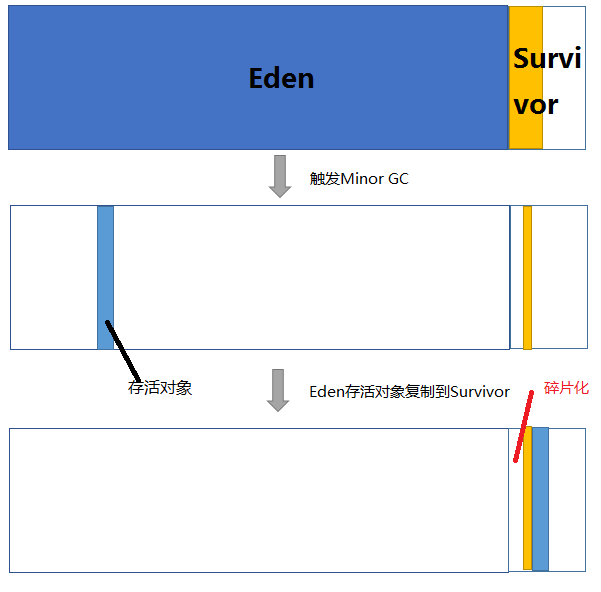
本质上来说,将 Survivor 拆分为 From 和 To 相等大小的两块内存模型,其目的就是解决内存碎片化带来的一系列的问题
对象 A 在 Eden 区创建,回收时转移 Survivor 区,这里都没什么问题,但是此时对象 B 在 Eden 创建后且触发了回收,B 在 Survivor 中该怎么落脚?很简单,继续叠加上去。那么对象 C 来了呢?继续叠加?那么此时 B 被回收掉了之后,B 所占用的内存得到了释放,但是并不能够真正很好利用这块内存,因为如果要用,就势必造成堆内存不连续的情况。下图描述的就是这么一个过程。
于是乎这么一个内存模型产生了
1
2
3
4
5
***********************************************************
* * * * *
* Eden * From(S0) * To(S1) * Tenured *
* * * * *
***********************************************************
嗯,对就是这么简单。
实际上对象的内存的复制过程是这样的:
1
2
3
4
①Eden 创建连续的内存区域 --> ② MinorGC 触发,Eden to S0 -->
③MinorGC 二次触发,Eden & S0 to S1 --> ④MinorGC 三次触发,Eden & S1 to S0 -->
如此往复......
直到某数据的回收超出 YGC 约定阀值后,数据转入到 Tenured 区
这样的设计意思是 S0 与 S1 之间的数据是不断互相整理并复制,这保证了 S0 和 S1其中有一个内存空间在某个时间节点上必须是空的,另一个内存空间则是无碎片化的。而从第三步开始,涉及到 S0 与 S1的内存间复制算法相当重要,也就是这个算法确保避免了 Survivor 区域内存碎片化的情况。
推荐阅读: